Showing posts with label social network analysis. Show all posts

Wednesday, November 27, 2013

Tools for social network analysis from beginners to advanced levels

This year I've been drawn to the power of social network analysis. Monday I'll be taking my exam of the Coursera MOOC about SNA. Even though this is quite a scientific course, you learn new ways of looking at networks and for instance using Gephi with all its possibilities. Tomorrow I have a webinar with a group of people interested in social network analysis, interested in the tools. What I'm doing in this blogpost is classifying some tools for network from EASY through INTERMEDIATE to DIFFICULT.

It's good to distinguish between EGOnetwork analysis and whole network analysis. An EGOnetwork analysis is mapping the network of relationships of one person (usually your own network!).  In Network analysis you identify a network, a friends network, a LinkedIn group or a community of practice, or in the course a dolphins network. There are some simple tools which can help you map your own social media network.
niveau1
LEVEL 1 EASY
Tools in level 1 are the Egonetwork tools which are available on the web and which make it possible to analyse your network in one click. You may do this in 1-2 hours.
  • With one click you can map your LinkedIn network (except if your network is too small or too large. It automatically colours the subnetworks. It is a good exercise to name these subnetworks. What kind of people would you like to have in your network.
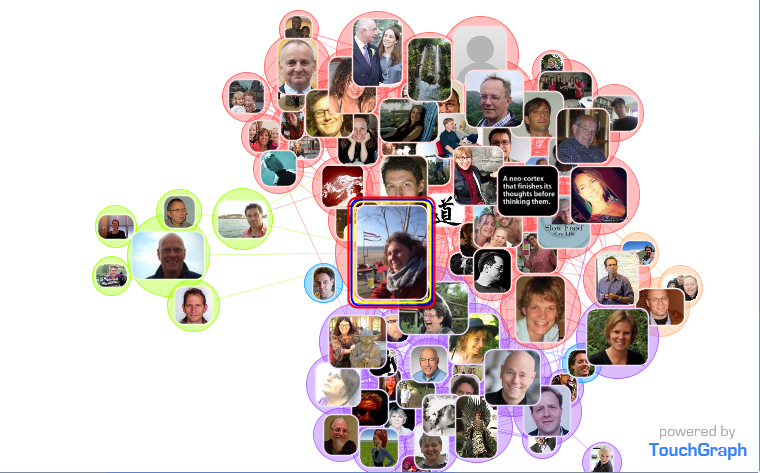
facebook netwerk nov 2013facebook netwerk touchgraph nov 2013


  •   You can do an Egonetwork analysis of your  Facebook network met Touchgraph - see pictures above. Just like with LinkedIn maps you can see subcommunities with different colours. Mijn main networks are my old IICD network and KM4dev/CPsquare networks. My friends network is the tiny part in green. That explains why I'm not that active on Facebook. You can actually do a lot of things with touchgraph, more than with linkedIn maps, like you can zoom in on your most important network, choose to show picture or names etc. See the examples above.  

niveau2LEVEL 2 INTERMEDIATE
Level 2 are tools that take more time to understand and work with. You may need a day or so, even though it is possible to learn it with tutorials from the web, or ask someone who knows the tools. Niveau 2 zijn tools die je wel even onder de knie moet krijgen. Nevertheless the tools are free: Gephi and NodeXL are both free and open source.. NodeXL is for windows and works with Excel.


  • You can download your Facebook network with Getnet  http://snacourse.com/getnetand then import it in Gephi. The difference with touchgraph is that you can do more analysis for instance look at the most influential people in your network.  

  • twitter netwerk toekomstglban interesting way of doing Network analysis of social media is with NodeXL you can import for instance Twitter Hashtag tweets, or a network of a twitter account (@joitske). I haven't tried a lot yet with NodeXL, I have been struggling a bit with the labels. Importing at times takes long because Twitter only allow a certain amount of data to be downloaded, so be prepared to set it up and let it run for a couple of hours. 
niveau3
LEVEL 3 DIFFICULT
The highest level of difficulty is doing a whole Network analysis with tools like Netdraw and Gephi. It is important to understand network measures like centrality measures and sub communities. It takes investment in knowing network theory and software.
  • Network analysis with Gephi. The SNA course used Gephi and I find it impression what you can calculate and analyse like average shortest path, modularities etc. I think it takes a good comparison with other networks to interprete these kind of overall network characteristics. See below a  Gephi example. Screen shot 2013-11-26 losmakers gephi
  • Similar to Gephi you can do Network analysis with Netdraw. So far I am very impressed with what you can do in Netdraw, especially the way you can visualize parts of the network and zoom in. For instance, if you have a network with agriculturalists, policy makers and advisors, you can plot the network of the advisors separately if you like. We did that for a large network zooming in on the provinces which was very useful to have a view of the network at provincial level. 

Thursday, October 31, 2013

Making the invisible visible with social network analysis


Together with Koen Faber, Josien Kapma and Niels Schuddeboom we have an informal dutch group who want to learn about social network analysis. Our learning curve is quite steep I would say! It helps me a lot to have likeminded people around me. For instance I signed up for the MOOC about social network analysis which started 4 weeks ago and which is interesting but also very scientific. I almost forgot about it during the first week but Koen telling me about the assignments (analyzing your own facebook network) stimulated me to dedicate more time and I even signed up for the signature track for the certificate.

We first got together somewhere before the summer and all blogged about our questions:
  • Josien wondered about the focus on the images versus the conversations amongst network members. It is good to have conversations about a network. What is the role of  'a true picture' of the network? The interpretation is more important - hence is it necessary to do all this effort to depict the network or could it also be a simple drawing? (costs less effort!) Read her blogpost in Dutch here. 
  • Koen wondered how to use maps effectively as reflection tools? and also Can network mapping show which people influence the course of the network? Whose influence is tipping the opinions in a network setting?
  • I also blogged about my learning questions here and I had 3 questions: Is it possible to do network analysis without collecting data by using social media connections? How much is the time invested in doing the SNA and does it justify the results in terms of surprises and new insights that would not have been possible to gain in other ways? Would it be possible to make the process more participatory? 
Since then, together we were engaged in 3 network analysis. Interesting was the diversity already in the 3 network analysis - the number of respondents ranged from 55 to almost 900, the purpose ranged from understanding and growing the network to evaluating the network. We used onasurveys to collect data and export and analyse it in Netdraw. I also used NodeXL to analyse a twitter hashtag and a twitter account. In the MOOC we are working a lot with Gephi to analyse data. Interestingly most tools are free or low cost (onasurveys is paid). 

I learned a lot and it is very timely that next week Friday (the 8th of November) we'll share our experiences with a group of network professionals in Utrecht. If you happen to be in the Netherlands and are interested you are very welcome - more information on this page. The title is: 

Social Network Analysis: just a bunch of nice images?  

I am very positive about social network analysis and it potential to gain insights into a network

* Social network analysis can give a different view into a network, which can be revealing and help to make strategic decisions on how to strengthen a network. First a short story to illustrate how social network analysis can give a different view with a more scientific basis. Koen came to my place by public transport and I told him that he could take the train and then take the tram, alternatively take the train to the central station and then the so-called randstadrail. When he arrived, he said he took the bus! I never thought about the bus because I dislike buses and they always tend to keep me waiting for long. So I discard this as an option. However, he used the public transport planner and the planner found the bus. This is an analogy to show what social network analysis can do for network members or facilitators. Though network members always have their own observations and may understand the network quite well - it helps to have an images constructed from the information given by the members which may reveal things otherwise unseen. Though this is also a case of rubish in rubish out, if people do not respond honestly or do it in a hurry, there may be biases in the data too. In one case, a sponsor to the network was invited. Though interesting for network members, they saw a lot of their impressions confirmed. However, they felt very proud that the sponsor could finally SEE the network...

* The invested time is not too much, it may not always be justified but in many cases it may be. As a rule of thumb I am now calculating 5 days of work including designing the survey with the network coordinators, testing the survey, sending it out, analyzing data, preparing visuals and interpreting the visuals. I'm amazed by how much you can do with the free software programs, though the more you use it, the more you realize how much is possible and which you don't understand. I never used Ucinet for example and there are so many ways to calculate overall network statistics. That's a whole new world to me. Besides it is very easy to import a twitter network into NodeXL or a Facebook network into Gephi. This is far easier than I imagined. So in half a day you could already analyze some social media data. 

* Working with the network members needs to be the core of the work. As we already thought, the interpretation and discussion with a representation of network members is very important. In all 3 cases we had a debriefing ranging from 1,5 to 3 hours, in which the images guide a discussion. I think it would be even better to have 2 sessions with the team. One session in which you show the images and what they represent - then sending out a short summary, followed by another session to talk about interventions. On the other hand, I realized that the work of the person designing and interpreting the survey is very important. He or she has an important part to play in choosing the right questions and filtering the images to show and interpret. 

* It is an art rather than a science. It is very important what kind of questions you ask and wording matters. It also matters a lot what you analyze and how you represent it. You have to develop a sense for the right questions and the images that will help the understanding.